 Defining the Points on the Wellpath
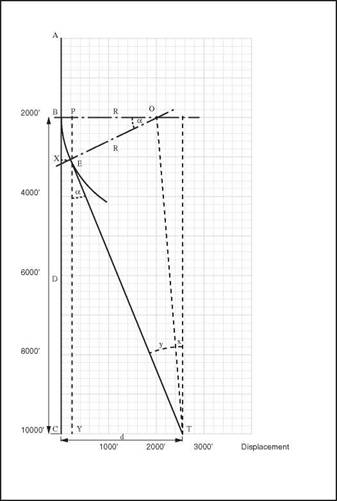
Having fixed the target and the rig position, the next stage is to plan the geometrical profile of the well to reach the target. The most common well trajectory is the build and hold profile, which consists of 3 sections — vertical, build-up and tangent.
The trajectory of the wellbore can be plotted when the following points have been defined :
• KOP (selected by designer)
• TVD and horizontal displacement of the end of the build up section.
• TVD and horizontal displacement of the target (defined by position of rig and target)
Since the driller will only be able to determine the along hole depth of the well the following information will also be required:
• AHD of the KOP (same as TVD of KOP)
• Build up rate for the build up section (selected by designer)
• Direction in which the well is to be drilled after the KOP in degrees from North (defined by position of rig and target)
• AHD at which the build up stops and the tangent section commences and
• AHD of the target
These depths and distances can be defined by a simple geometrical analysis of the
well trajectory (Figure 4).
Radius of the Build Up Section:
The radius R of the build up section of the well can be calculated from the build-up rate ( Yo/100ft) :
|
Y0 _ 100ft 360 2n(R) |
D_ 36000
R—————————-
2n(Y)
Tangent Angle:
The tangent angle, a of the well (Figure 4) can be calculated as follows:
d — R
tan x =——————
D
Rcosx
siny=———————
D
a=x + y
Note : It is possible for angle x to be negative if d < R, but these equations are still valid.
Once the tangent angle is known the other points on the wellpath can be calculated as follows:
|
|
AHD at the end of build section:
The measured depth at end of build section, AE:
AE = AB + BE (curved length)
TOC o "1-5" h z BE a
BE can be calculated from —————— =
2nR 360
TVD at the end of the build Section:
The TVD at end of build section, AX is
AX = AB + PE where PE = R sin a AX = AB + R sin a
Displacement at the end of build Section:
The horizontal deviation at end of build, XE is
XE = OB — OP where OB = R OP = R cos a XE = R — R cos a
AHD of the target:
The total measured depth, AT is
AT = AE + ET Example:
The planning procedure for the build and hold trajectory is best illustrated by considering the following example:
Basic Data:
|
2000 ft 10000 ft 3000 ft 2 degrees/100 ft |
KOP (BRT)
TVD of target (BRT) horizontal Displacement of Target build-up rate
|
Figure 4 Design of the Well Trajectory 4.2.1 Scaled Diagrams Using a scaled diagram, this information can simply be plotted on a piece of graph paper using a compass and a ruler (Figure 4). Point A represents the rig location on surface. Point B is the KOP at 2000′. Point T is the target. Point O defines the centre of the arc which forms the Buildup section. |
The radius OB can be calculated from build-up rate:
2o 100′ ^ 9000
i. e. =—————— OB=——————————————— =2866.24
360 2n(OB) n
An arc of this radius can be drawn to define the build-up profile. A tangent from T can then be drawn to meet this arc at point E. The drift angle TEY can then be measured with a protractor. Note that TEY = BOE. From this information the distances BX, XE, BE, EY can be calculated.
This method of defining the well trajectory is not however very accurate, since an error of 1 degree or 2 degrees in measuring TEY with a protractor may mean that the tangent trajectory is imprecise and that the target may be missed by the driller.

