 Detection Based on Drilling Parameters
The theory behind using drilling parameters to detect overpressured zones is based on the fact that:
• Compaction of formations increases with depth. ROP will therefore, all other things being constant, decrease with depth
• In the transition zone the rock will be more porous (less compacted) than that in a normally compacted formation and this will result in an increase in ROP. Also, as drilling proceeds, the differential pressure between the mud hydrostatic and formation pore pressure in the transition zone will reduce, resulting in a much greater ROP
The use of the ROP to detect transition and therefore overpressured zones is a simple concept, but difficult to apply in practice. This is due to the fact that many factors affect the ROP, apart from formation pressure (e. g. rotary speed and WOB). Since these other effects cannot be held constant, they must be considered so that a direct relationship between ROP and formation pressure can be established. This is achieved by applying empirical equations to produce a “normalised” ROP, which can then be used as a detection tool.
The “d” exponent technique for detection of overpressures is based on a normalised drilling rate equation developed by Bingham (1964). Bingham proposed the following generalised drilling rate equation:
R = aN’ (fj1
|
where, |
|
|
R |
= penetration rate (ft/hr) |
|
N |
= rotary speed (rpm) |
|
W |
= WOB (lb) |
|
B |
= bit diameter (in.) |
|
a |
= matrix strength constant |
|
d |
= formation drillability |
|
e |
= rotary speed exponent |
Jordan and Shirley (1966) re-organised this equation to be explicit in “d”. This equation was then simplified by assuming that the rock which was being drilled did not change (a = 1) and that the rotary speed exponent (e) was equal to one. The rotary speed exponent has been found experimentally to be very close to one. This removed the variables which were dependent on lithology and rotary speed. This means however that the resulting equation can only be applied to one type of lithology and theoretically at a single rotary speed. The latter is not too restrictive since the value of e is generally close to 1(one). On the basis of these assumptions and accepting these limitations the following equation was produced:
d = log(60N) log(106B )
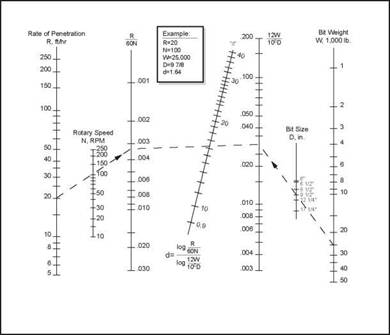
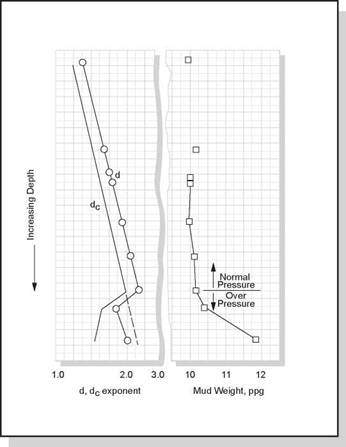
This equation is known as the “d-exponent” equation. Since the values of R, N, W and B are either known or can be measured at surface the value of the d-exponent can be determined and plotted against depth for the entire well. Values of “d” can be found by using the nomograph in Figure 14. Notice that the value of the d-exponent varies inversely with the drilling rate. As the bit drills into an overpressured zone the compaction and differential pressure will decrease, the ROP will increase, and so the d-exponent should decrease. An overpressured zone will therefore be identified by plotting d-exponent against depth and seeing where the d-exponent reduces (Figure 15).
|
Figure 14 Nomogram for calculating "d" exponent |
It should be realised that this equation takes into account variations in the major drilling parameters, but for accurate results the following conditions should be maintained:
• No abrupt changes in WOB or RPM should occur, i. e. keep WOB and RPM as constant as possible.
|
• A good thick shale is required to establish a reliable “trend” line. Institute of Petroleum Engineering, Heriot-Watt University |
• To reduce the dependence on lithology the equation should be applied over small depth increments only (plot every 10′).
It can be seen that the d-exponent equation takes no account of mudweight. Since mudweight determines the pressure on the bottom of the hole the greater the mudweight the greater the chip hold-down effect and therefore the lower the ROP. A modified d-exponent (dc) which accounts for variations in mudweight has therefore been derived:
|
^(Р |
d d (MWA
dc — dMWay
where,
MWn = “normal” mud weight
MWa = actual mud weight
The dc exponent trend gives a better definition of the transition (Figure 15).
|
Figure 15 Comparison of d and dc drilling exponents used in geopressure detection |
The d exponent is generally used to simply identify the top of the overpressured zone. The value of the formation pressure can however be derived from the modified d-exponent, using a method proposed by Eaton (1976):
P = S rs 1 Щ 12
D D |D Wjjdcnj
where,
P = fluid pressure gradient (psi/ft)
D
S = overburden gradient (psi/ft)
D
dco = observed dc at given depth
dcn = dc from normal trend (i. e. extrapolated) at given depth Eaton claims the relationship is applicable worldwide and is accurate to 0.5 ppg.
Torque can be useful for identifying overpressured zones. An increase in torque may occur of the decrease in overbalance results in the physical breakdown of the borehole wall and more material, than the drilled cuttings is accumulating in the annulus. There is also the suggestion that the walls of the borehole may squeeze into the open hole as a result of the reduction in differential pressure. Drag may also increase as a result of these effects, although increases in drag are more difficult to identify.
Exercise 2 ‘d’ and ‘dc’ Exponent
a. Whilst drilling the 12 1/4" hole section of a well the mudloggers were recording the data as shown in the table below. Plot the d and dc exponent and determine whether there are any indications of an overpressured zone.
b. If an overpressured zone exists, what is the depth of the top of the transition zone.
c. Use the Eaton equation to estimate the formation pressure at 8600 ft.
Assume a normal formation pressure of 0.465 psi/ft. an overburden gradient of 1.0
psi/ft and a normal mud weight for this area of 9.5 ppg.
|
DEPTH (ft.) |
ROP (ft./hr) |
RPM |
WOB (,000 lbs) |
MUD WEIGHT PPG |
|
7500 |
125 |
120 |
38 |
9.5 |
|
7600 |
103 |
120 |
38 |
9.5 |
|
7700 |
77 |
110 |
38 |
9.5 |
|
7800 |
66 |
110 |
38 |
9.6 |
|
7900 |
45 |
110 |
35 |
9.6 |
|
8000 |
37 |
110 |
37 |
9.8 |
|
8100 |
40 |
110 |
35 |
9.8 |
|
8200 |
42 |
110 |
33 |
9.9 |
|
8300 |
41 |
100 |
33 |
10.0 |
|
8400 |
44 |
100 |
38 |
10.25 |
|
8500 |
34 |
100 |
38 |
10.25 |
|
8600 |
33 |
100 |
40 |
11 |
|
8700 |
32 |
110 |
42 |
11 |

