 FIELD TESTS ON DRILLING FLUIDS
The properties of drilling mud are regularly measured by the mud engineer. These measurements will be used to determine if the quality of the mud has deteriorated and requires treatment. The properties required to fulfil the tasks discussed in the earlier part of the chapter will be specified by the drilling engineer before the drilling operation commences but these properties may be adjusted if for instance
it is found that the drilled cuttings are not being removed efficiently or if losses are experienced.
A summary of the tests common to both water based and oil-based muds is given below :
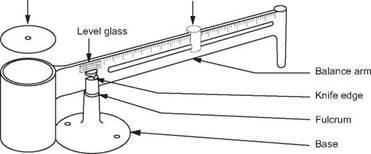
The density of the drilling mud can be determined with the mud balance shown in Figure 4. The cup of the balance is completely filled with a sample of the mud and the lid placed firmly on top (some mud should escape through the hole in the lid). The balance arm is placed on the base and the rider adjusted until the arm is level. The density can be read directly off the graduated scale at the left-hand side of the rider.
Mud densities are usually reported to the nearest 0.1 ppg (lbs per gallon). Other units in common use are lbs/ft3, psi/ft, psi/1000ft, kg/l and specific gravity (S. G.).
|
Rider
Figure 4 Mud balance |
The rheological character of drilling fluids is discussed at length in the chapter on Drilling Hydraulics. In general terms however, viscosity is a measure of a liquids resistance to flow. Two common methods are used on the rig to measure viscosity:
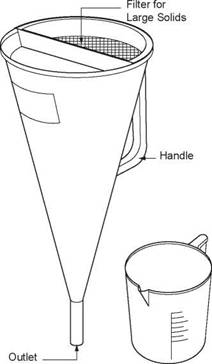
Marsh funnel (Figure 5): The Marsh Funnel shown in Figure 5 is used to make a very quick test of the viscosity of the drilling mud. However, this device only gives an indication of changes in viscosity and cannot be used to quantify the rheological properties of the mud, such as the Yield Point or Plastic Viscosity.
|
Measuring Jug Figure 5 Marsh funnel and graduated cup |
The standard funnel is 12" long, has a 6" diameter at the top and a 2" long, 3 /16" diameter tube at the bottom. A mud sample is poured into the funnel and the time taken for one quart (946 ml) to flow out into a measuring cup is recorded. (Fresh water at 75oF has a funnel viscosity of 26 sec/quart.)
Non-newtonian fluids (i. e. most drilling fluids) exhibit different viscosities at different flow rates and since the flow rate of the mud varies throughout this test it cannot provide a quantitative assessment of the rheological properties of the mud. The funnel viscosity can only be used for checking radical changes in mud viscosity. Further tests must be carried out before any treatment can be recommended.
|
О |
I 11
|
|
|
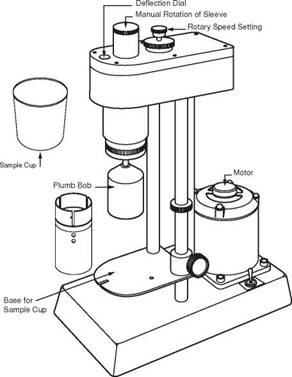
Figure 6 Multi-rate viscometer |
. Deflection dial
|
|
|
|
.Spring
|
Figure 7 Typical graph drawn from viscometer results |
Rotational viscometer (Figure 6): The multi-rate rotational viscometer is used to quantify the rheological properties of the drilling mud. The assessment is made by shearing a sample of the mud, at a series of prescribed rates and measuring the shear stress on the fluid at these different rates. The essential elements of the
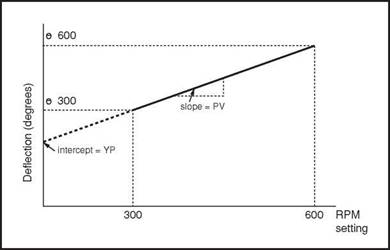
device (Figure 7) are a plumb bob attached to a torsion spring and deflection gauge and a cylinder which can be rotated at a range of rotary speeds. The plumb bob is suspended inside the cylinder and the whole is immersed in a sample of the drilling mud. When the outer cylinder is rotated the mud between the cylinder and plumb bob is sheared. The deflection of the plumb bob is a measure of the viscosity of the drilling fluid at that particular shear rate. The shear rate and deflection can be plotted as shown in Figure 8.
|
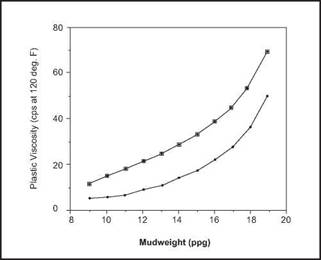
Figure 8 Acceptable range of PV for a given Mudweight |
The test is conducted at a range of different speeds: 600 rpm; 300 rpm; 200 rpm; 100 rpm; 6 rpm and 3 rpm. The standard procedure is to lower the instrument head into the mud sample until the sleeve is immersed up to a scribe line. The rotor speed is set at 600 rpm and after waiting for a steady dial reading this value is recorded (degrees). The speed is changed to 300 rpm and again the reading is recorded. This is repeated until all of the required dial readings have been recorded. The results are plotted as shown in Figure 8. If there is a linear relationship between shear stress and shear rate (i. e. Bingham plastic) the following parameters can be calculated from the graph:
Plastic Viscosity (PV) = D600 — D300 (centipoise)
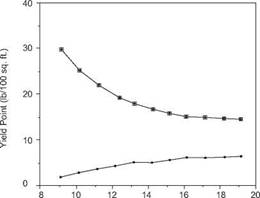
Yield Point (YP) = D300 — PV (lb/100 ft2)
The gel strength of the drilling mud can be thought of as the strength of any internal structures which are formed in the mud when it is static. These structures are discussed in the section of water based muds in section 3 below. The gel strength of the mud will provide an indication of the pressure required to initiate flow after the mud has been static for some time. The gel strength of the mud also provides an indication of the suspension properties of the mud and hence its ability to suspend cuttings when the mud is stationary.
The gel strength can be measured using the multi-rate viscometer. After the mud has remained static for some time (10 secs) the rotor is set at a low speed (3 rpm) and the deflection noted. This is reported as the initial or 10 second gel. The same procedure is repeated after the mud remains static for 10 minutes, to determine the 10 minute gel. Both gels are measured in the same units as Yield Point (lbs/ 100ft2). Gel strength usually appears on the mud report as two figures (e. g. 17/25). The first being the initial gel and the second the 10 minute gel.
|
Mudweight (ppg) |
Figure 9 Acceptable range of YP for a given Mudweight
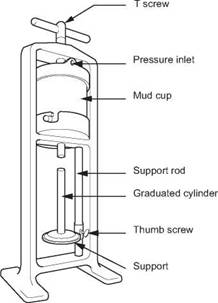
The filter cake building properties of mud can be measured by means of a filter press (Figure 10). The following are measured during this test:
|
|
|
Cell |
|
|
|
|
|
Base cap with filtrate tube |
|
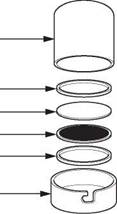
Rubber gasket Filter paper Screen Rubber gasket |
|
С |
Filtrate tube
Figure 10 Filter press apparatus
• The rate at which fluid from a mud sample is forced through a filter under specified temperature and pressure.
• The thickness of the solid residue deposited on the filter paper caused by the loss of fluids.
The first of the above reflects the efficiency with which the solids in the mud are creating an impermeable filter cake and the second the thickness of the filter cake that will be created in the wellbore. Notice that this type of test does not accurately simulate downhole conditions in that only static filtration is being measured. In the wellbore, filtration is occurring under dynamic conditions with the mud flowing past the wall of the hole.
The instrument shown in Figure 10 consists of a mud cell, pressure assembly and filtering device. The API standard test is at room temperature and 100 psi pressure. A special cell must be used to conduct the test at high pressure and temperature (500 psi, 300 degrees F). The cell is closed at the bottom by a lid which is fitted with a screen. On top of the screen is placed a filter paper which is pressed up against an O-ring seal. A graduated cylinder is placed under the screen to collect the filtrate. The pressure of 100 psi is applied for a period of 30 minutes and the volume of filtrate can then be measured (in cm3). When the pressure is bled off the cell can be opened and the filter paper examined. The thickness of the filter cake is measured in 1/32’s of a inch.
|
|
A high proportion of sand in the mud can damage the mud pumps and is therefore undesirable. The percentage of sand in the mud is therefore measured regularly using a 200 mesh sieve and a graduated tube (Figure 11). The glass measuring tube is filled with mud up to the scribe line. Water is then added up to the next scribe line. The fluids are mixed by shaking and then poured through the sieve. The sand retained on the sieve should be washed thoroughly to remove and remaining mud. A funnel is fitted to the top of the sieve and the sand is washed into the glass tube by a fine spray of water. After allowing the sand to settle the sand content can be read off directly as a percentage.
|
|
|
Solids Scale |
|
Sand Filters |
|
Measuring Cylinder |
|
Figure 11 Sand Content Apparatus |
If pipe sticking is to be avoided, the proportion of solids in the mud should not exceed 10% by volume. A carefully measured sample of mud is heated in a retort until the liquid components are vaporised. The vapours are then condensed, and collected in the measuring glass. The volume of liquids (oil and/or water) is read off directly as a percentage. The volume of solids (suspended and dissolved) is found by subtraction from 100%.
The pH of the mud will influence the reaction of various chemicals and must therefore be closely controlled. The pH test is a measure of the concentration of hydrogen ions in an aqueous solution. This can be done either by pHydrion paper or by a special pH meter. The pH paper will turn different colours depending on the 16
concentration of hydrogen ions. A standard colour chart can be used to read off the pH to the nearest 0.5 of a unit (on a scale of 0 to 14). With a pH meter the probe is simply placed in the mud sample and the reading taken after the needle stabilises (make sure probe is washed clean before use). The meter gives a more accurate result to 0.1 of a unit.
Although pH gives an indication of alkalinity it has been characteristics of a high pH mud can vary considerably despite constant pH. A further analysis of the mud is usually carried out to assess the alkalinity. The procedure involves taking a small sample, adding phenolphthalein indicator and titrating with acid until the colour changes. The number of ml of acid required per ml of sample is reported as the alkalinity. (Pf = filtrate alkalinity, Pm = mud alkalinity). Another parameter related to Pf and Pm is lime content. This can be calculated from:
lime content = 0.26 (Pm — FwPf)
where,
lime content is in lb/bbl
Fw= volume fraction of water in the mud.
The amount of chloride in the mud is a measure of the salt contamination from the formation. The procedure for measuring the quantity of salt in the mud is to take a small sample of filtrate of the mud, adding phenolphthalein and titrating with acid until the colour changes. 25 — 50 ml of distilled water and a small amount of potassium chromate solution is then added. The solution is stirred continuously while silver nitrate is added drop by drop. The end point is reached when the colour changes. The chloride content is calculated from:
Cl content (ppm) = ml of silver nitrate x 1000 ml of filtrate sample
This test gives an approximate measure of the bentonite (sodium montmorillonite) content of the mud. The sodium cation (Na+) of bentonite is held loosely on the clay structure and is readily exchanged for other ions and certain organic compounds. Methylene blue is an organic dye which will replace the exchangeable cations in montmorillonite and certain other mud additives (eg organic compounds such as CMC, lignite). A small mud sample is put in a flask where it is first treated with hydrogen peroxide to remove most of the organic content. Methylene blue solution is added in increments of 0.5 ml. After each increment the flask is well shaken, and while the solids are still suspended one drop is placed on filter paper. The end point is reached when the dye appears as a greenish-blue ring around the solids on the filter paper.
The methylene blue capacity = ml of methylene blue
ml of mud sample
The bentonite content (lb/bbl) = 5 x methylene blue capacity. The cation exchange capacity of other solids can be done in a similar way. The capacity can be expressed in milliequivalents of methylene blue per 100 g of solids (Table 1). Note the high reading for montmorillonite clay compared with other clays.
