 Summary of Procedures
When planning a well the formation pore pressures and fracture pressures can be predicted from the following procedure:
1. Analyse and plot log data or d-exponent data from an offset (nearby) well.
2. Draw in the normal trend line, and extrapolate below the transition zone.
3. Calculate a typical overburden gradient using density logs from offset wells.
4. Calculate formation pore pressure gradients from equations (e. g. Eaton).
5. Use known formation and fracture gradients and overburden data to calculate a typical Poisson’s ratio plot.
6. Calculate the fracture gradient at any depth.
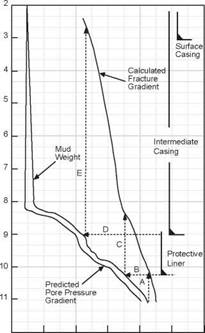
Basically the three gradients must be estimated to assist in the selection of mud weights and in the casing design. One example is shown in Figure 28. Starting at line A representing 18 ppg mud it can be seen that any open hole shallower than 10,200′ will be fractured. Therefore a protective casing or liner must be run to seal off that shallower section before 18 ppg mud is used to drill below 10200′.
To drill to 10,200′ a 16 ppg mud (line B) must be used. This mud will breakdown any open hole above about 8,300′(line C). This defines the setting depth of the protective casing (and the height of the liner).
To drill to 8,300′ a 13 ppg mud is required (line E). This mud will breakdown any open hole above 2,500′, so this defines the surface casing shoe. Note that casing shoes are usually set below indicated breakdown points as an added safety factor.
|
8 10 12 14 16 18 20 Equivalent Mud Weight, ppg |
Figure 28 Example of how pore pressure and fracture gradients can be used to
select casing seats
|
v |
||||||||||||||||||||||||||||||||||||||||||||
|
\ |
4 |
|||||||||||||||||||||||||||||||||||||||||||
|
, |
||||||||||||||||||||||||||||||||||||||||||||
|
4 |
||||||||||||||||||||||||||||||||||||||||||||
|
N |
||||||||||||||||||||||||||||||||||||||||||||
|
4 |
||||||||||||||||||||||||||||||||||||||||||||
|
N |
||||||||||||||||||||||||||||||||||||||||||||
|
P |
Si |
/ft |
O |
9v |
er |
bu |
rd |
ei |
l G |
r |
d |
e |
it |
|||||||||||||||||||||||||||||||
|
4 |
||||||||||||||||||||||||||||||||||||||||||||
|
4 |
||||||||||||||||||||||||||||||||||||||||||||
|
4 |
||||||||||||||||||||||||||||||||||||||||||||
|
V |
||||||||||||||||||||||||||||||||||||||||||||
|
Л |
, |
|||||||||||||||||||||||||||||||||||||||||||
|
N |
||||||||||||||||||||||||||||||||||||||||||||
|
n |
46 |
5 |
ps |
i/f |
t |
N |
||||||||||||||||||||||||||||||||||||||
|
‘N |
p |
s |
||||||||||||||||||||||||||||||||||||||||||
|
M |
ud |
w |
t. |
de |
Si |
gr |
Ю |
d |
||||||||||||||||||||||||||||||||||||
|
fo |
8 |
5n |
Ю |
|||||||||||||||||||||||||||||||||||||||||
|
N, |
||||||||||||||||||||||||||||||||||||||||||||
|
Л |
JC |
S |
G |
C |
ie |
it |
||||||||||||||||||||||||||||||||||||||
|
I |
||||||||||||||||||||||||||||||||||||||||||||
|
( |
||||||||||||||||||||||||||||||||||||||||||||
|
fo |
r |
95 |
nn |
|||||||||||||||||||||||||||||||||||||||||
|
2n |
n |
i |
V |
|||||||||||||||||||||||||||||||||||||||||
|
i |
r |
|||||||||||||||||||||||||||||||||||||||||||
|
2 |
nn |
p |
Si |
|
Exercise 1 Pore Pressure Profiles 0 |
|
1000 |
|
2000 |
|
3000 |
|
4000 |
|
5000 |
|
6000 |
|
7000 |
|
8000 |
|
9000 |
|
10000 |
|
1000 2000 3000 4000 5000 6000 7000 Pressure psi |
|
Q. d) О |
b. The pore pressure gradients in the formations from surface are:
0 — 8000 ft 3720/8000 = 0.465 psi/ft
0 — 8500 ft 6850/8500 = 0.800 psi/ft
0 — 9500 ft 6900/9500 = 0.726 psi/ft
Required Mudweight:
@ 8000 ft
TOC o "1-5" h z 3720 + 200 = 3920 psi
3920/8000 = 0.49 psi/ft ^ 9.42 ppg
@ 8500 ft 6800 + 200 = 7000 psi
7000/8500 = 0.82 psi/ft = 15.77 ppg
@ 9500 ft 6900 + 200 = 7100 psi
7100/9500 = 0.75 psi/ft = 14.42 ppg
c. If the mudweight of were 9.42 ppg were used to drill at 8500 ft the underbalance would be:
6800 — (8500 x 9.42 x 0.052) = 2636 psi Hence the borehole pressure is 2636 psi less than the formation pressure.
d. If, when using 0.82 psi/ft (or 15.77 ppg) mud for the section at 8500ft, the fluid level in the hole dropped to 500ft the bottom hole pressure would fall by:
500 x 0.82 = 410 psi
Hence the pressure in the borehole would be 210 psi below the formation pressure.
e. The density of the fluid in the formation between 8500 and 9500 ft is:
6900 — 6800 = 0.1 psi/ft 1000
The fluid in the formations below 8500 ft is therefore gas.
Exercise 2 ‘d’ and ‘dc’ Exponent
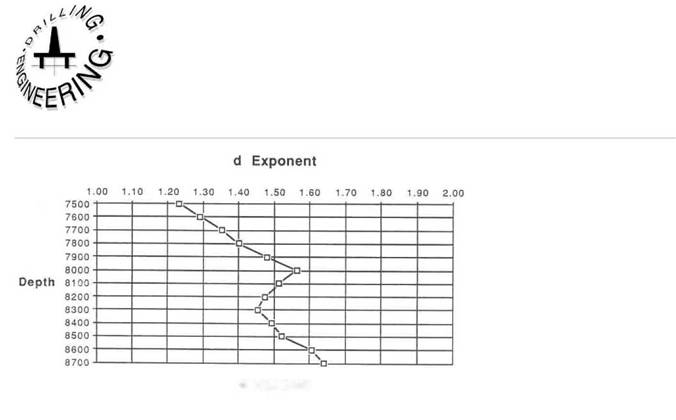
Whilst drilling this section of 12 1/4” hole the mudloggers were also recording data which would allow them to plot the d and dc exponents for this shale section. This data is compiled and the d and dc exponents calculated as shown in Table 2.1. A plot of the d and dc exponents in Figure 2.1 and 2.2 confirms that the top of the overpressured zone is at 8000 ft.
|
Institute of Petroleum Engineering, Heriot-Watt University |
|
Ј 53- L* a. м з a a. о m if? "3 О 3 rt 3 |
|
Formation Pressures |
|
DEPTH |
HOP |
RPM |
WOB |
d EXPONENT |
MUDWEIGHT |
dc EXPONENT |
|
FT. |
FT/HR |
000 LBS |
PPG |
|||
|
7500 |
125 |
120 |
38 |
1.23 |
9.5 |
1.23 |
|
7600 |
103 |
120 |
38 |
1.29 |
9.5 |
1.29 |
|
7700 |
77 |
110 |
38 |
1.35 |
9.5 |
1.35 |
|
7800 |
66 |
110 |
38 |
1.40 |
9.6 |
1.38 |
|
7900 |
45 |
110 |
35 |
1.48 |
9.6 |
1,46 |
|
8000 |
37 |
110 |
37 |
1.56 |
9.3 |
1.60 |
|
8100 |
40 |
110 |
35 |
1.51 |
9.8 |
1.47 |
|
8200 |
42 |
110 |
33 |
1.47 |
9.9 |
1.41 |
|
8300 |
41 |
1 00 |
33 |
1.45 |
1 0 |
1.38 |
|
8400 |
44 |
100 |
38 |
1.49 |
10.25 |
1.38 |
|
8500 |
34 |
100 |
38 |
1.57 |
10.25 |
1.46 |
|
8600 |
33 |
100 |
40 |
1.61 |
1 1 |
1.39 |
|
8700 |
32 |
110 |
42 |
1.67 |
1 1 |
1.44 |
|
From the attached plot of the above data the top of the overpressured zone is 8000 ft. |
|
BIT SIZE IN. |
12.25 |
|
NORMAL MUDWEIGHT PPG |
9.5 |
|
OVERBURDEN GRAD. PPG |
19.3 |
|
FORM. GRAD. PPG |
8.9 |
|
d EXPONENT |
|
|
|
Figure 2.1 d Exponent Plot |
|
d Exponent |
|
7500 7600 7700 7600 7900 8000 Depth 8Ю0 8200 8300 8400 8500 8600 8700 |
|
N, |
|||||||||
|
% |
|||||||||
|
•n |
|||||||||
|
s |
|||||||||
|
j |
|||||||||
|
i |
|||||||||
|
1 |
|||||||||
|
r |
|||||||||
|
1.00 1.10 1.20 1.30 1.40 1.50 1.60 1.70 1.80 1.90 2.00 |
|
dc Exponent |
Figure 2.2 dc Exponent Plot
Exercise 3 Leak-Off Test
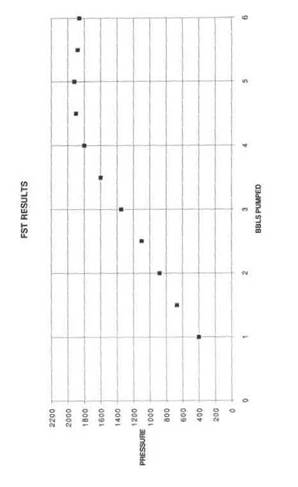
After drilling out of the 13 3/8” shoe, but before drilling ahead the 12 1/4” hole a leak off test was performed. It can be seen from Figure 3.1 that at 1800 psi surface pressure the uniform increase in mud volume pumped into the hole did not result in a linear increase in the pressure observed at surface. This is an indication that the formation at the casing shoe has failed and that the fluid pumped into the well is escaping into fractures in the formation.
The maximum pressure that the formation will withstand at the shoe (assumed to be the weakest point in the next hole section) is therefore 1800 psi with 9 ppg mud in the hole. Thus the maximum absolute pressure that the formation will withstand (with zero surface pressure) is:
(9 x 0.052 x 7000) + 1800 = 5076 psi.
The maximum allowable mudweight that can be used in the next hole section is:
5076/7000 = 0.73 psi/ft
= 13.95 ppg
|
9.5 + (300/7500)/0.052 = 10.27 ppg |
If it is anticipated that a mudweight greater than this is required then consideration should be given to setting another string of casing prior to entering the zone that will require this higher mudweight. A safety margin of 0.5 ppg underweight is generally subtracted from the allowable mudweight calculated above.
|
Figure 3.1 FST Results Exercise 4 Equivalent Circulating Density — ECD If the circulating pressure losses in the annulus of the above well are 300 psi when drilling at 7500ft, the ECD of a 9.5 ppg mud at 7500ft would be: |


