 SURVEY CALCULATIONS AND PLOTTING RESULTS
A description of directional well profile planning was given in chapter 11. Large scale plots, drawn by computer, are normally available to show the trajectory of the well. Both vertical and horizontal plots are used (Figure 1). The purpose of having these plans is to allow the engineers to plot the actual position of the well as it is being drilled. By carrying out this exercise they can detect any serious difference between the planned path and the actual path. It is also used to plan any correction run that must be made. When drilling from a multi-well platform it is useful to have plans showing the position of adjacent wells also.
The purpose of all the calculations described above is to fix the co-ordinates of the wellbore on a horizontal and vertical plan. On a single well, all depths are initially referenced to the rotary table. On a multi-well platform the co-ordinates of the survey stations in all of the wells will then be referenced to the same reference point so that comparisons with adjacent wells can easily be made. The reference point is usually the centre of the drilling template or wellhead area.
The steps involved in calculating and plotting the position of the survey stations are as follows:
|
Ј |
a. Calculate the position of the survey station:
The vertical and horizontal (in the Northerly and Easterly direction) displacement of the survey station from the previous station is calculated using one of the models discussed in section 2.7 above.
b. Calculate the displacement of the station in the vertical section:
A particular line along which the well displacement can be measured and represented must be selected. The obvious line to choose from is the wellhead reference point to the target. This is sometimes called the Target Bearing. Once the N and E co-ordinates of the new survey station are fixed the true horizontal distance from the survey station back to the reference point can be calculated (closure). This distance must then be projected onto the target bearing. The distance measured along the target bearing to this point is known as the vertical section (i. e. the section measured along a vertical plane containing the reference point and the target). Having calculated the TVD and the vertical section for each survey station the position of the well can be plotted on the vertical plane.
c. Calculate the dogleg severity of the section:
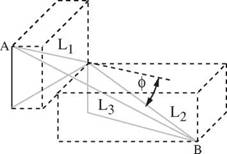
Another parameter that is always calculated is the dog-leg severity. The Dog-leg severity is the total three dimensional angular change between stations and can be calculated as shown in Figure 8. Usually the operating company will place some limit on the amount of bending which can be allowed between survey stations (e. g. 5 degrees/100′). This will ensure that casing and downhole tools can be run without getting stuck. It is therefore important to monitor the dog-leg severity at each survey station. The dog-leg severity (DLS) is obtained by dividing the change in angle by the course length between the stations, and then multiplying by 100. The dog-leg severity (DLS) is then obtained by dividing the change in angle by the course length between the stations, and then multiplying by 100.
To derive the formula to calculate the dog-leg angle consider the survey stations shown in Figure 8. At the upper station the inclination and azimuth have been measured as aA and PA. At the the lower station the corresponding angles are aA and PB. These angles define the two straight line segments whose lengths are L and L2. The change in total angle (f) between these two segments is shown as in the diagram. The size of the angle f can be determined by considering the triangle bounded by the lines L L2 and L3.
Dog leg angle = cos-1{ cosaA cosaB + sinaA sinaB cos (PA — PB)}
= cos-1{cos5o cos8o + sin5o sin8o cos (145o — 135o )}
= 3.2
If the measured depth between A and B is 90ft, then the dog leg severity is given by:
DLS = 32_ x 100 = 3.6o per 100′ 90
|
Figure 8 Dog-leg angle |
