 Detecting Top of Cement (TOC)
(a) Temperature surveys (Figure 24)
This involves running a thermometer inside the casing just after the cement job. The thermometer responds to the heat generated by the cement hydration, and so can be used to detect the top of the cement column in the annulus.
(b) Radioactive surveys (Figure 25)
Radioactive tracers can be added to the cement slurry before it is pumped (Carnolite is commonly used). A logging tool is then run when the cement job is complete. This tool detects the top of the cement in the annulus, by identifying where the radioactivity decreases to the background natural radioactivity of the formation.
Detecting Top of Cement (TOC) and the Measuring the Quality of the Cement Bond
(a) Cement bond logs (CBL)
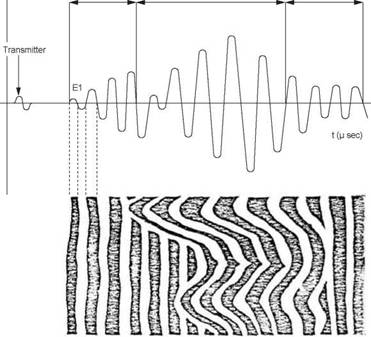
The cement bond logging tools have become the standard method of evaluating cement jobs since they not only detect the top of cement, but also indicate how good the cement bond is. The CBL tool is basically a sonic tool which is run on wireline. The distance between transmitter and receiver is about 3 ft (Figure 26). The logging tool must be centralised in the hole to give accurate results. Both the time taken for the signal to reach the receiver, and the amplitude of the returning signal, give an indication of the cement bond. Since the speed of sound is greater in casing than in the formation or mud the first signals which are received at the receiver are those which travelled through the casing (Figure 27). If the amplitude (Ej) is large (strong signal) this indicates that the pipe is free (poor bond). When cement is firmly bonded to the casing and the formation the signal is attenuated, and is characteristic of the formation behind the casing.
(b) the Variable Density Log (VDL)
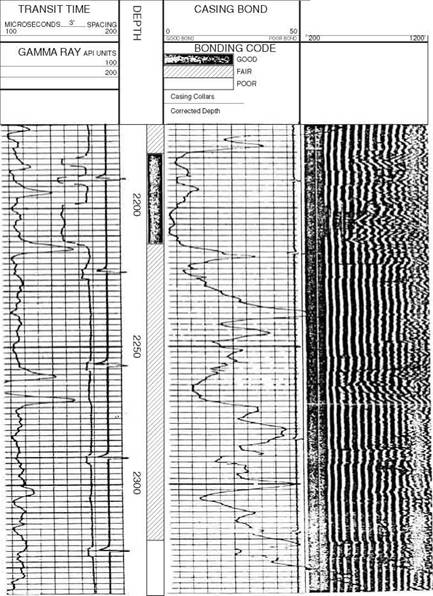
The CBL log usually gives an amplitude curve and provides an indication of the quality of the bond between the casing and cement. A VDL (variable density log), provides the wavetrain of the received signal (Figure 28), and can indicate the quality of the cement bond between the casing and cement, and the cement and the formation. The signals which pass directly through the casing show up as parallel, straight lines to the left of the VDL plot. A good bond between the casing and cement and cement and formation is shown by wavy lines to the right of the VDL plot. The wavy lines correspond to those signals which have passed into and through the formation before passing back through the cement sheath and casing to the receiver. If the bonding is poor the signals will not reach the formation and parallel lines will be recorded all across the VDL plot.
The interpretation of CBL logs is still controversial. There is no standard API scale to measure the effectiveness of the cement bond. There are many factors which can lead to false interpretation:
• During the setting process the velocity and amplitude of the signals varies significantly. It is recommended that the CBL log is not run until 24 — 36 hours after the cement job to give realistic results.
• Cement composition affects signal transmission
• The thickness of the cement sheath will cause changes in the attenuation of the signal
• The CBL will react to the presence of a microannulus (a small gap between casing and cement). The microannulus usually heals with time and is not a critical factor. Some operators recommend running the CBL under pressure to eliminate the microannulus effect
|
Amplitude Casing mV arrivals Formation arrivals Mud arrivals
Figure 27 Signals picked up by receiver |
%
|
VARIABLE DENSITY MICROSECONDS 5 SPACING
Figure 28 Example of CBL/VDL |

