 Drilled Cuttings
Since overpressured zones are associated with under-compacted shales with high fluid content the degree of overpressure can be inferred from the degree of compaction of the cuttings. The methods commonly used are:
• Density of shale cuttings
• Shale factor
• Shale slurry resistivity
Even the shape and size of cuttings may give an indication of overpressures (large cuttings due to low pressure differential). As with the drilling mud parameters these tests can only be done after a lag time of some hours.
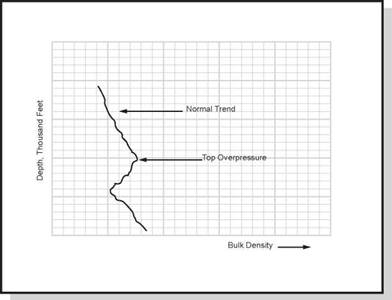
In normally pressured formations the compaction and therefore the bulk density of shales should increase uniformly with depth (given constant lithology). If the bulk density decreases, this may indicate an undercompacted zone which may be an overpressured zone. The bulk density of shale cuttings can be determined by using a mud balance. A sample of shale cuttings must first be washed and sieved (to remove cavings). These cuttings are then placed in the cup so that it balances at
8.3 ppg (equivalent to a full cup of water). At this point therefore:
p x V = p x V,
г s s ~ w t
where:
ps = bulk density of shale pw = density of water Vs = volume of shale cuttings Vt = total volume of cup
The cup is then filled up to the top with water, and the reading is taken at the balance point (p). At this point
p Vt = Ps Vs + Pw (Vt — Vs)
Substituting for Vs from the first equation gives:-
Pw2 ps = —
2Pw — P
A number of such samples should be taken at each depth to check the density calculated as above and so improve the accuracy. The density at each depth can then be plotted (Figure 17).
|
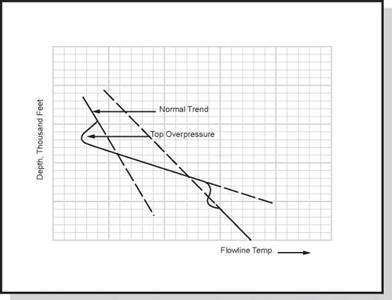
Figure 16 Flowline temperature to detect overpressure |
This technique measures the reactive clay content in the cuttings. It uses the “methylene blue” dye test to determine the reactive montmorillonite clay present, and thus indicate the degree of compaction. The higher the montmorillonite, the lighter the density — indicating an undercompacted shale.
|
Figure 17 Bulk density to detect overpressure |
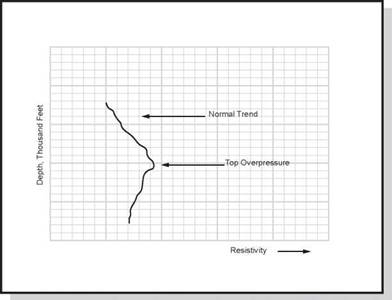
As compaction increases with depth, water is expelled and so conductivity is reduced. A plot of resistivity against depth should show a uniform increase in resistivity, unless an undercompacted zone occurs where the resistivity will reduce. To measure the resistivity of shale cuttings a known quantity of dried shale is mixed with a known volume of distilled water. The resistivity can then be measured and plotted (Figure 18).
After the hole has been successfully drilled certain electric wireline logs and pressure surveys may be run to confirm the presence of overpressures. The logs which are particularly sensitive to undercompaction are : the sonic, density and neutron logs. If an overpressured sand interval has been penetrated then the pressure in the sand can be measured directly with a repeat formation tester or by conducting a well test.
|
Figure 18 Resistivity. to detect overpressure |


